Using Jaeger to Capture Traces
This is meant to be the first in a series of posts covering the basics of Opentelemetry tracing in rust. I’m going to skip the definition of a trace for now and hope to define them in a follow on post. This post will focus on getting Jaeger running and having a rust binary send traces to Jaeger.
Jaeger
Jaeger is a tool that supports collection and visualization of traces. Jaeger is fairly easy to get up and running with Docker, so has been my preferred means of looking at traces when running applications locally. One needs to ensure they have a some kind of docker engine running and then the following command can be run:
docker run -d --name jaeger \
 -p 16686:16686 \
 -p 4317:4317 \
 -p 4318:4318 \
 jaegertracing/all-in-one:latest
This command will create local docker container named jaeger. It will map the
three ports 1 to 1 from the host to into the docker container.
- 16686 is used to access the Jaeger graphical interface via a browser
- 4317 is the common port for Opentelemetry tracing using GRPC
- 4318 is the common port for Opentelemetry tracing using HTTP
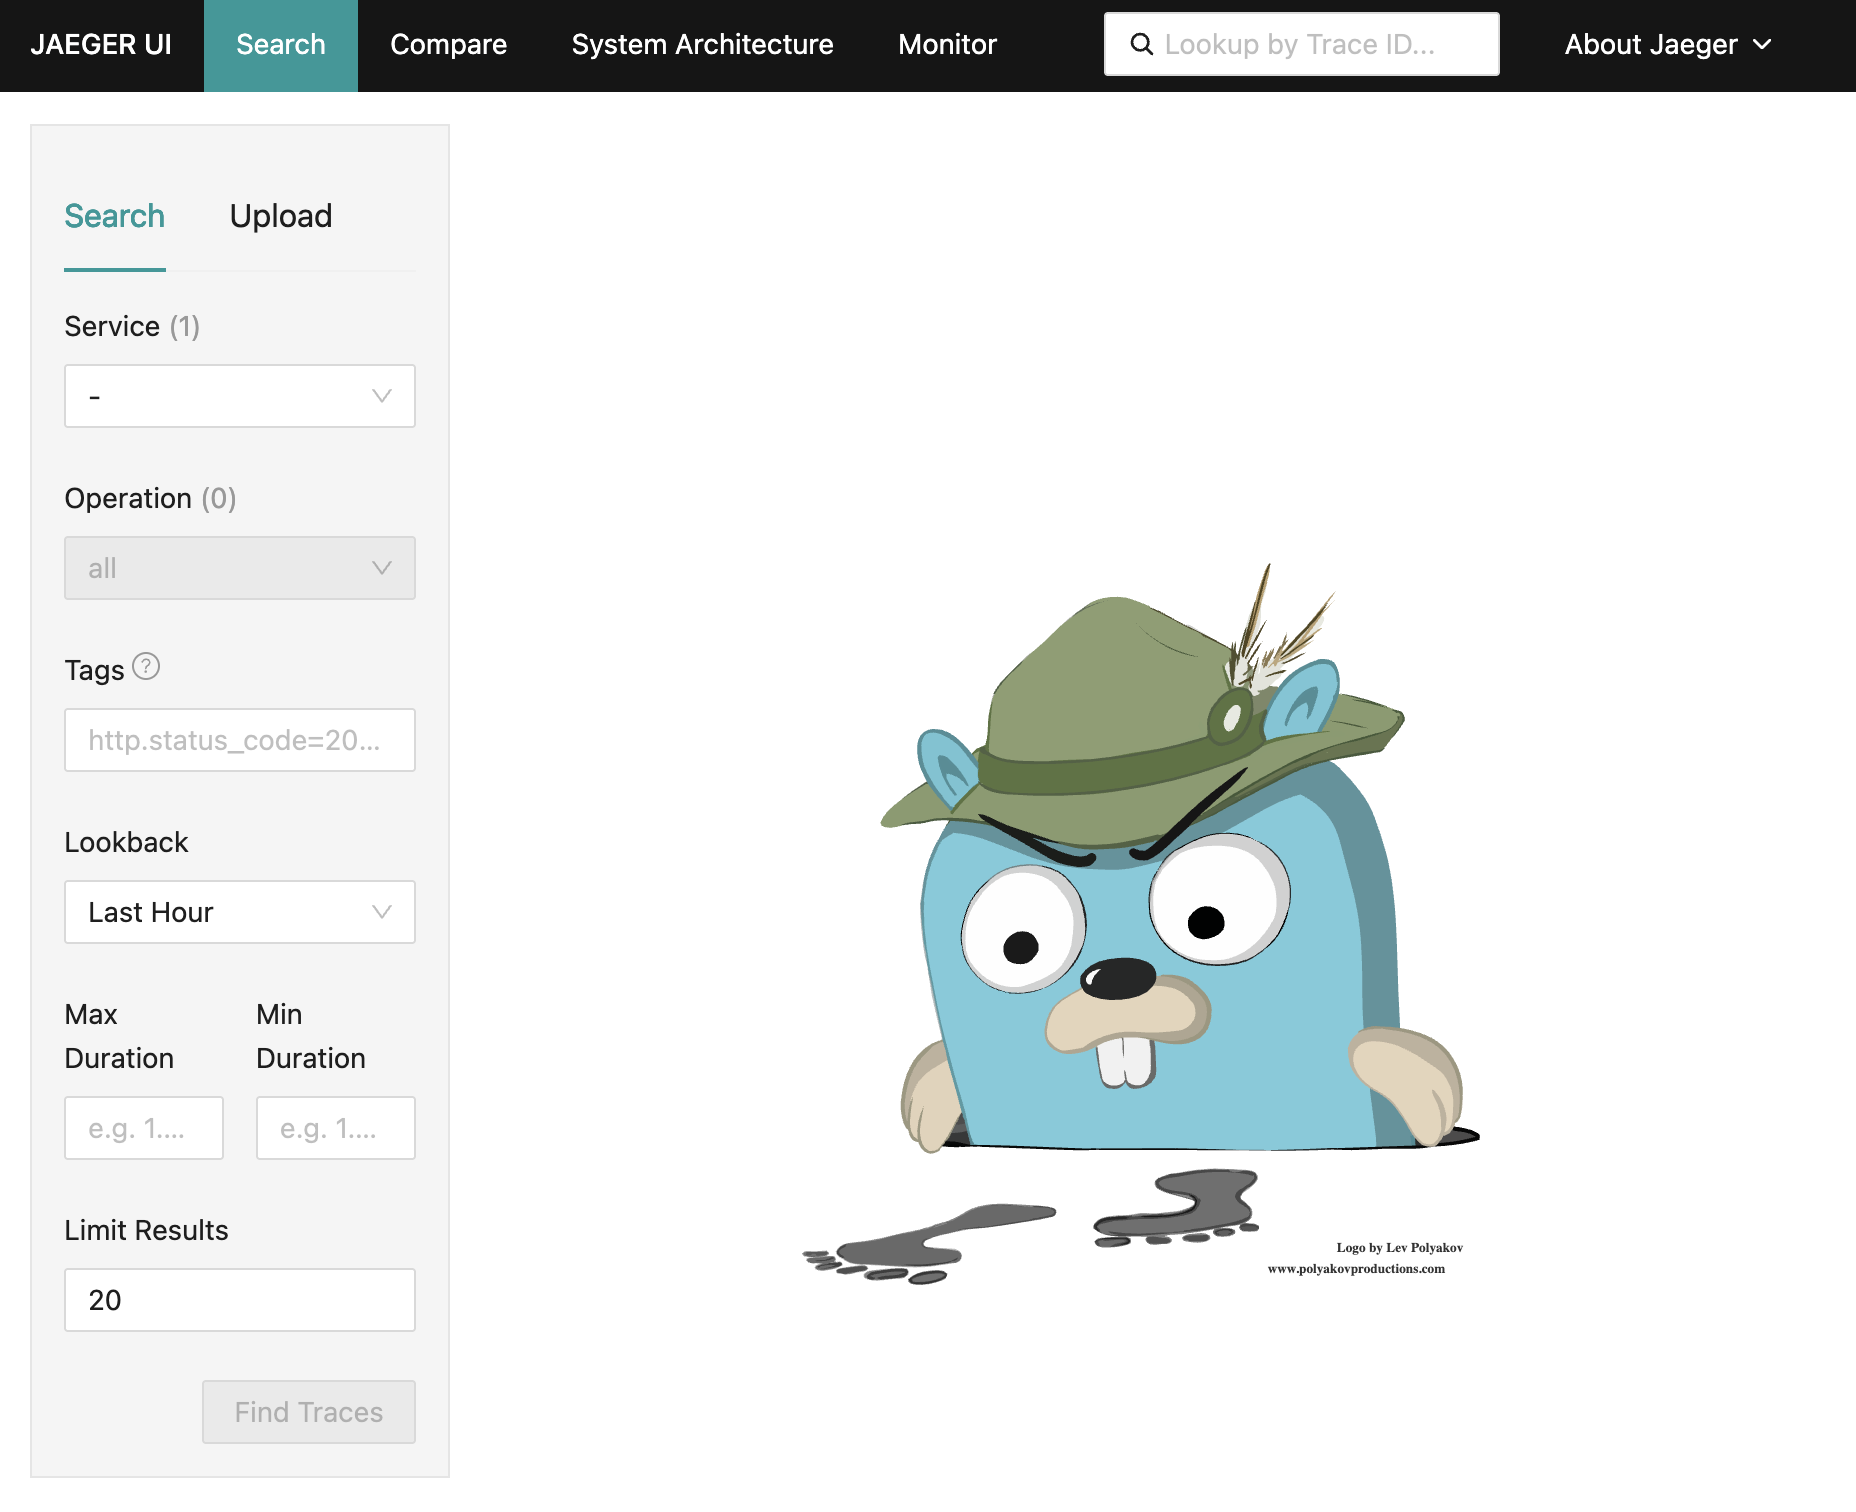
After running this command one should be able to navigate to
http://localhost:16686 and see:
Traces With Rust
The following rust script provides a working example that will export traces for Jaeger to collect. A follow on post will be provided which will break down the steps.
A few things to note:
- The version of the
opentelemetry*crates all need to be the same. - The
opentelemetry*rust api has changed between the0.##versions. This script may not work with other versions of theopentelemetry*crates. - The
tracing-opentelemetrycrate version is specific to theopentelemetry*crate versions. At this timetracing-opentelemetryis usually one version greater than theopentelemetry*crates. - The script uses the currently unstable cargo script feature.
#!/usr/bin/env -S cargo +nightly -Zscript
---cargo
[dependencies]
tracing = "0.1"
opentelemetry = "0.31"
opentelemetry_sdk = "0.31"
opentelemetry-otlp = "0.31"
tracing-opentelemetry = "0.32"
tracing-subscriber = "0.3"
---

use opentelemetry::trace::TracerProvider;
use opentelemetry_otlp::{Protocol, WithExportConfig};
use opentelemetry_sdk::Resource;
use std::{thread::sleep, time::Duration};
use tracing::instrument;
use tracing_subscriber::{layer::SubscriberExt, util::SubscriberInitExt};

fn main() -> Result<(), Box<dyn std::error::Error>> {
    let exporter = opentelemetry_otlp::SpanExporter::builder()
        .with_http()
        .with_protocol(Protocol::HttpJson)
        .build()?;
    let resource = Resource::builder()
        .with_service_name("tracing-example")
        .build();
    let provider = opentelemetry_sdk::trace::SdkTracerProvider::builder()
        .with_resource(resource)
        .with_simple_exporter(exporter)
        .build();
    let tracer = provider.tracer("tracer-name");
    let telemetry = tracing_opentelemetry::layer().with_tracer(tracer);
    tracing_subscriber::registry().with(telemetry).init();

    step1();
    step2();
    Ok(())
}

#[instrument]
fn step1() {
    sleep(Duration::from_millis(10));
    println!("Step 1");
    inside_step1();
}

#[instrument]
fn inside_step1() {
    sleep(Duration::from_millis(30));
    println!("Inside Step 1");
}

#[instrument]
fn step2() {
    sleep(Duration::from_millis(20));
    println!("Step 2");
}
The script can be saved to something like tracing.rs and then run in a *nix
environment.
chmod a+x tracing.rs
./tracing.rs
After the script has been run one can either refresh the Jaeger UI, or open it again, http://localhost:16686.
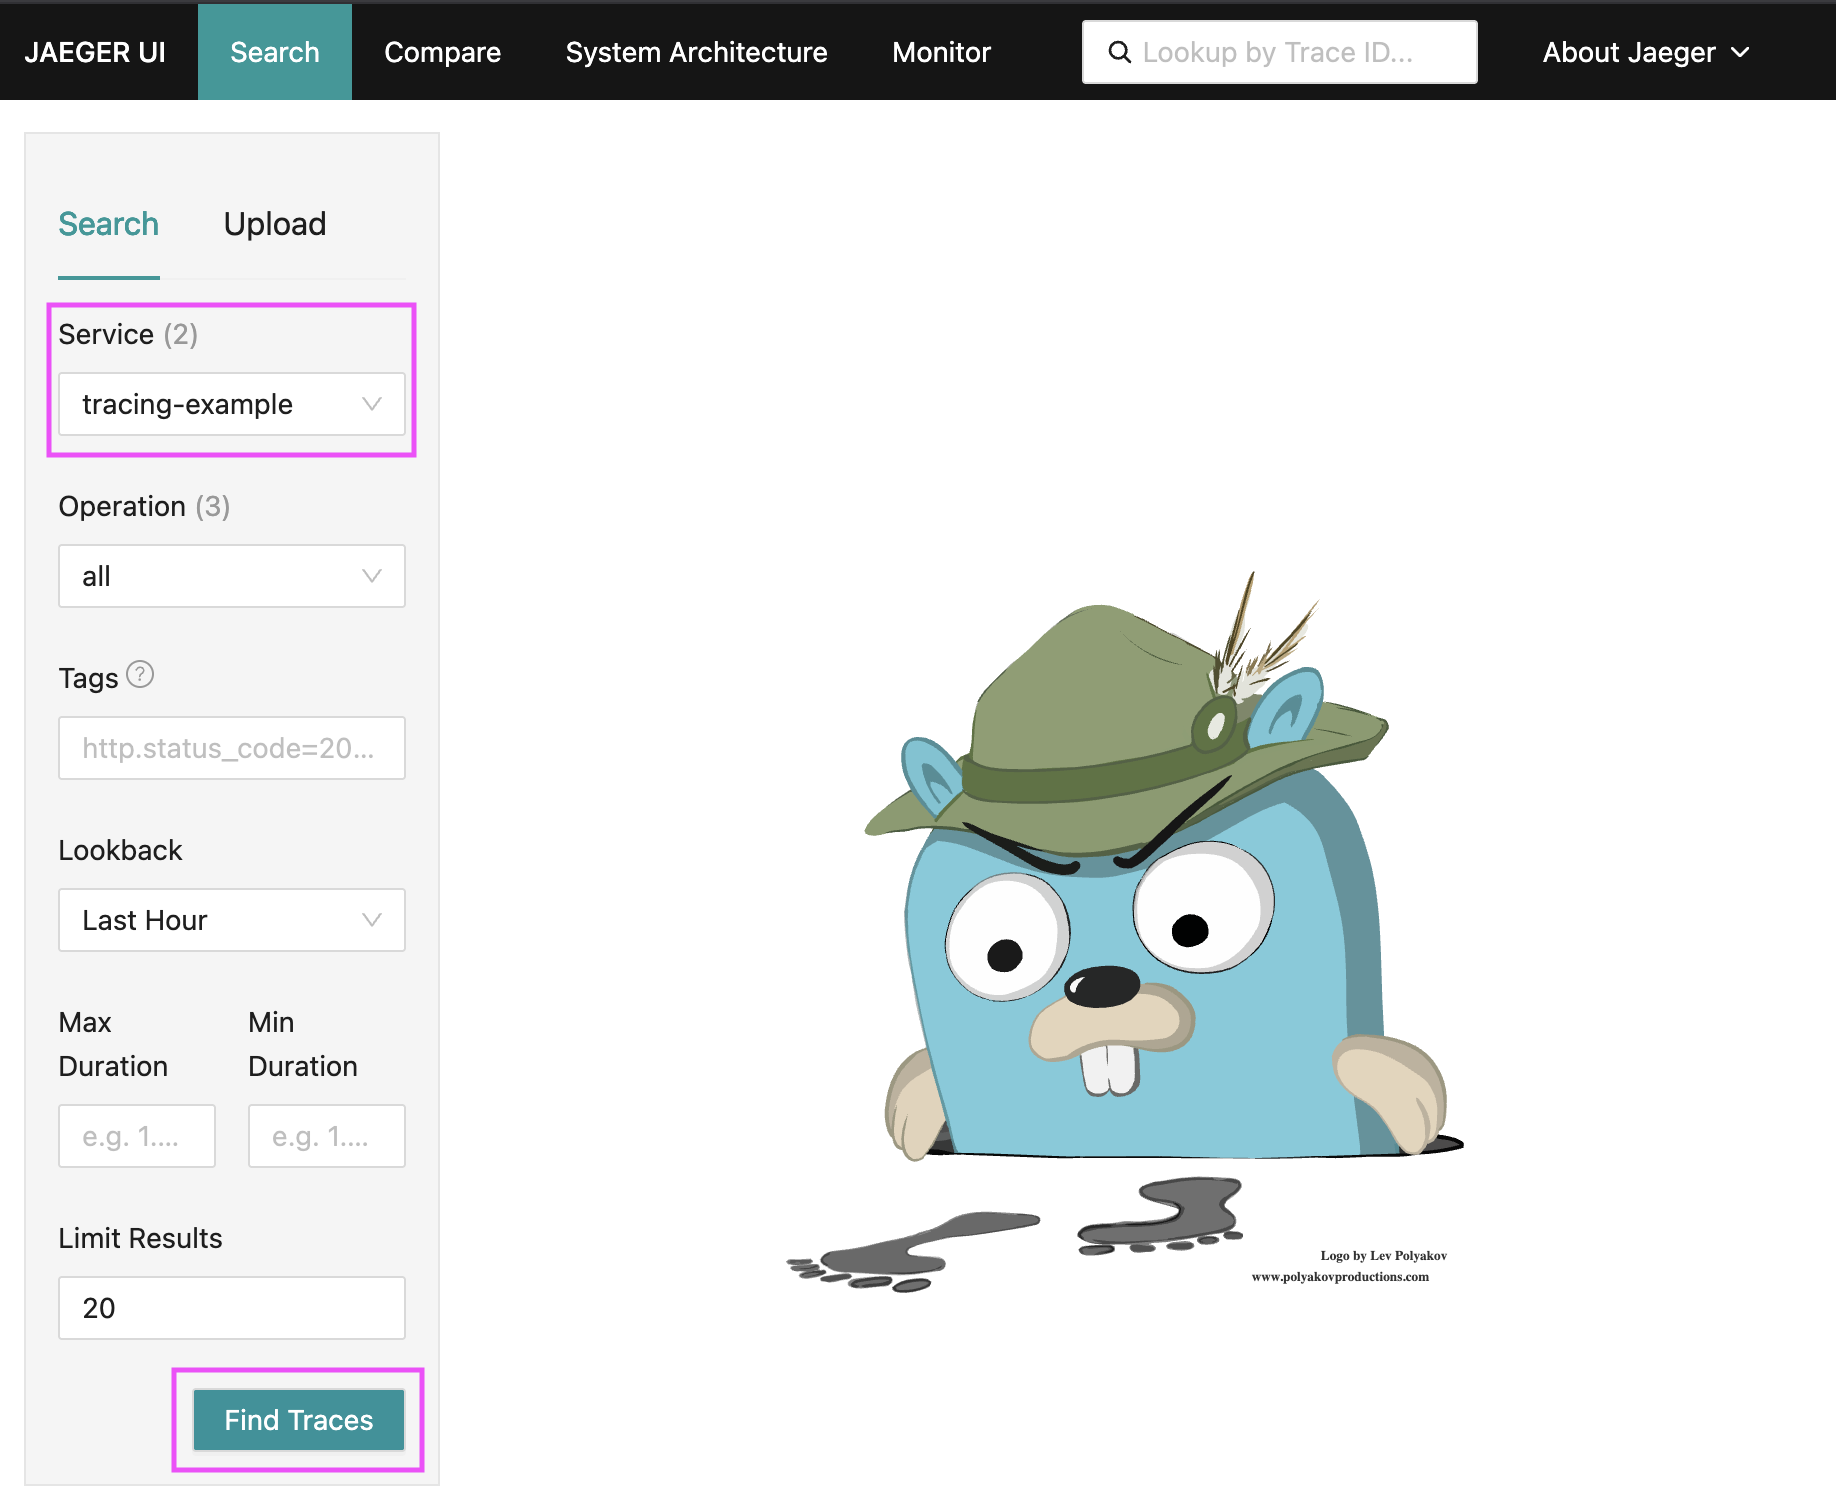
When Jaeger refreshes it will likely show the tracing-example in the Service
drop down. If it doesn’t, select it form the drop down.
Clicking the Find Traces button should result in Jaeger showing the captured traces:
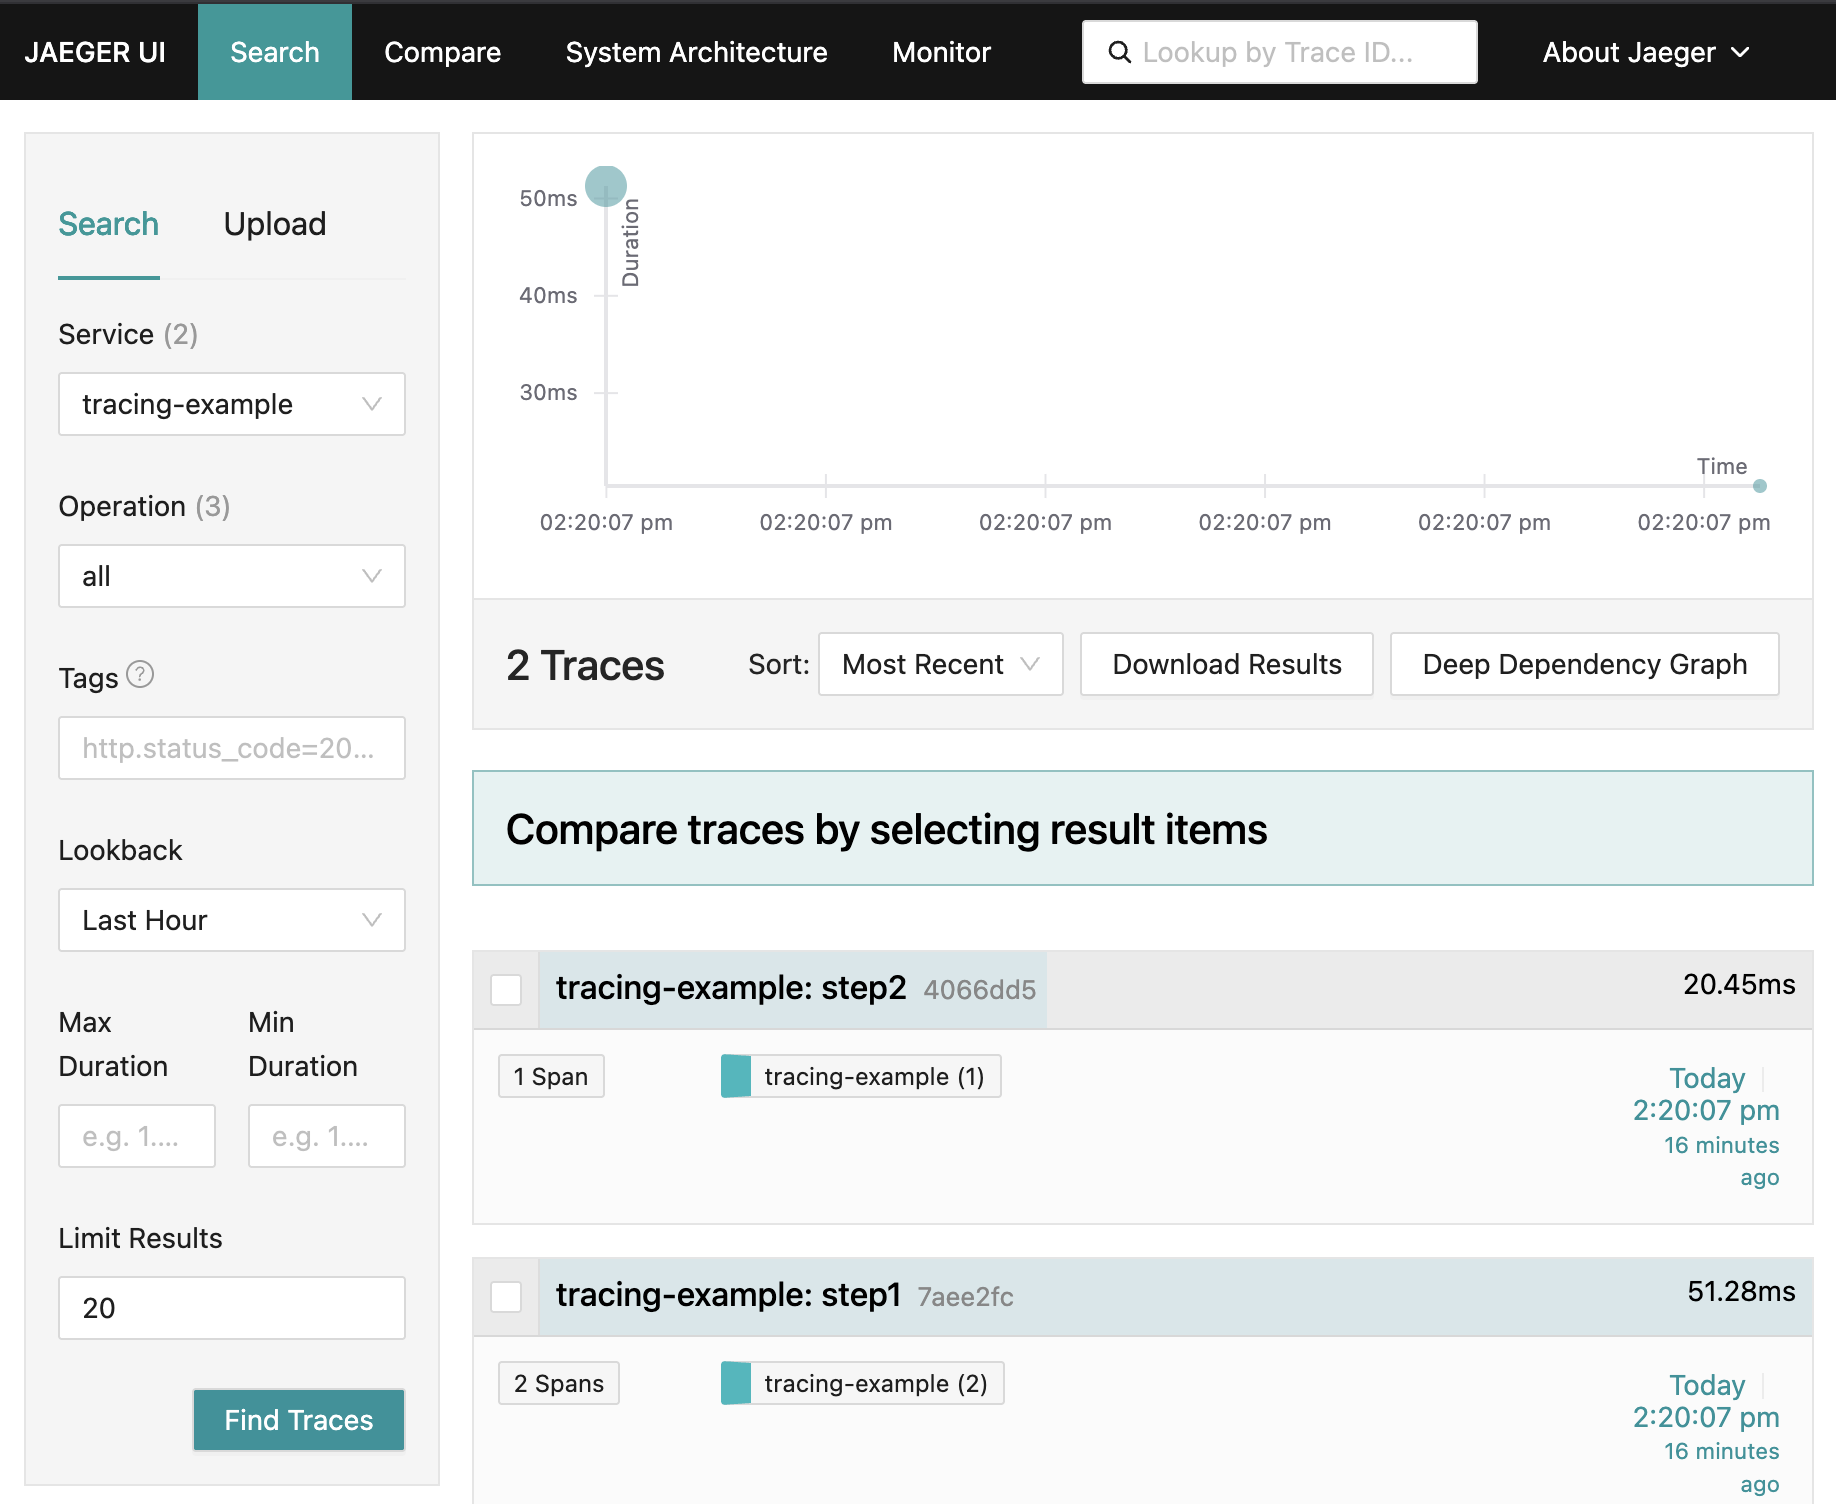
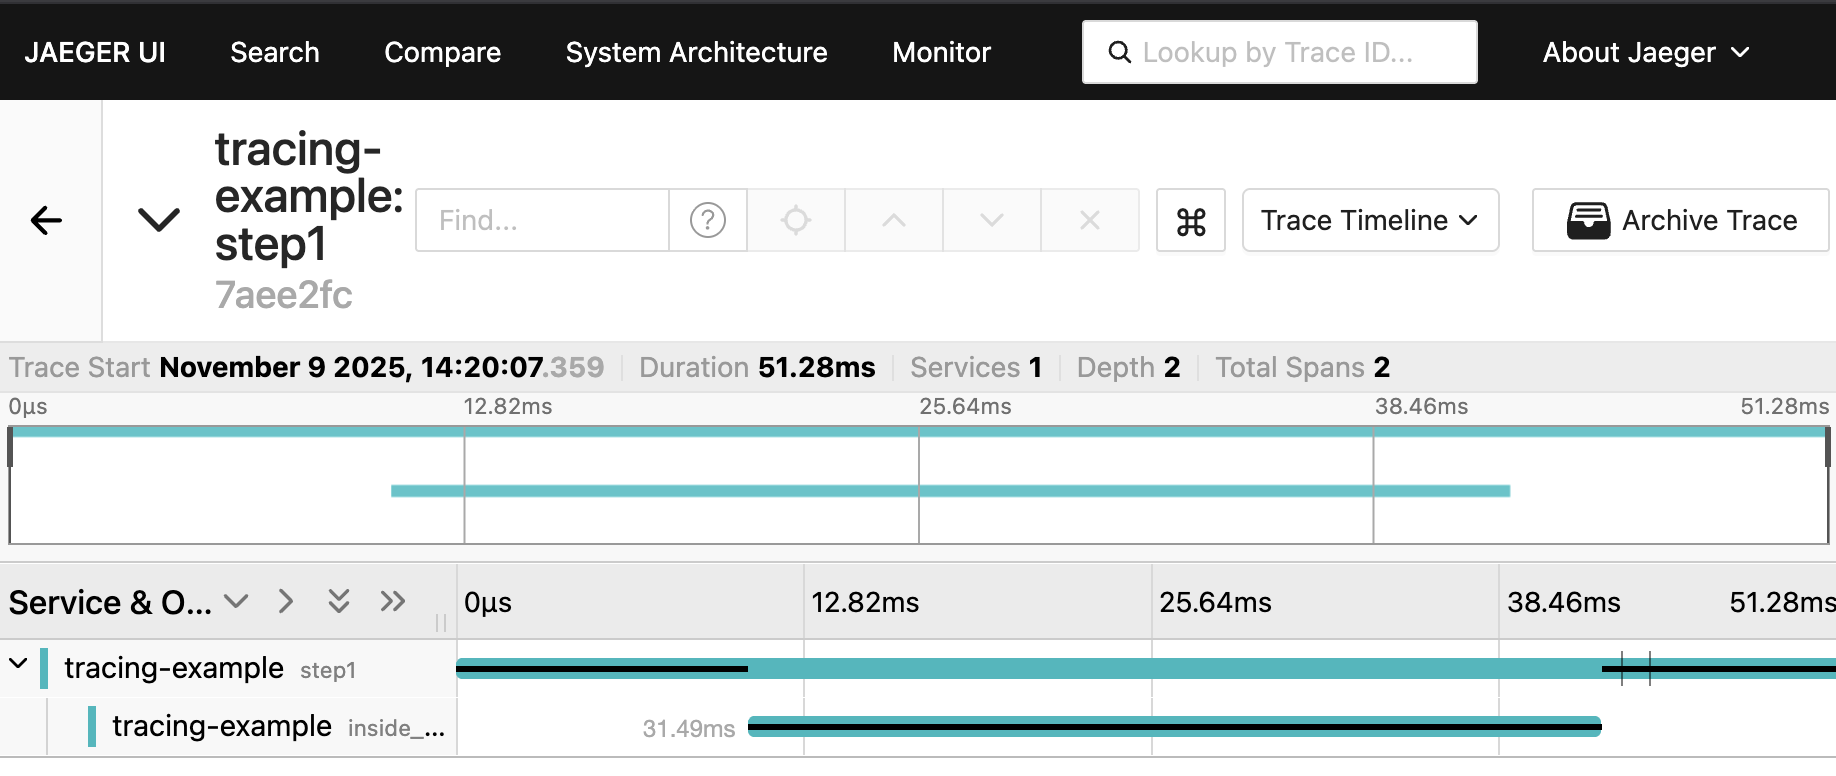
Clicking anywhere in the cyan title bar that says tracing-example: step1
should result in page similar to:
The Jaeger docker container will not persist trace data. This means one can reset the Jaeger state by restarting the docker container.
docker stop jaeger && docker start jaeger
References
- Jaeger docs, https://www.jaegertracing.io/docs/1.74/getting-started/
- Opentelemetry docs for tracing https://opentelemetry.io/docs/concepts/signals/traces