Profiling Rust On Windows
Working on my rust project, win-git-status, I finally got to the point where I was walking the working tree and getting the file modification times.
Initial performance testing against the llvm-project on commit 0f9f0a40
was at ~6 seconds. This is no where near the 0.340 seconds I was getting from git status,
Efficientlly Walking File Directories in Rust
Doing some quick googling led me to the profiling chapter of The Rust
Performance Book. Almost every tool on there was *nix based.
Doing some more googling I ran across this reddit post which
mentions using the Windows Performance Analyzer (WPA).
I had heard of WPA before from reading Finding build bottlenecks with C++ Build Insights. However I never really thought to look further into what WPA is and what it could do. After playing with it a bit here, I think I’ve been missing out on a powerful tool for profiling on Windows.
Using WPA to Profile Rust
In the same reddit post which recommended WPA, also mentioned to enable debug symbols in the release build. For those that are new to profiling, one generally want’s to profile in release mode. The debug builds will often skip optimizations to make debugging easier to do. Since the optimizations may not be performed what you profile in debug may not actually exist in release.
In rust one simply needs at add the debug=true option to the Cargo.toml
file:
[profile.release]
debug = true
UIforETW
It seemed that many suggested the use of UIforETW. This looks to be
maintained by a user named randomascii, who has a pretty thurogh blog which
a nice link to common profiling posts,
https://tinyurl.com/etwcentral.
I think most of the instructions provided by randomascii on their blog as
well as the instructions provided in the repo for UIforETW. It really is just as simple as:
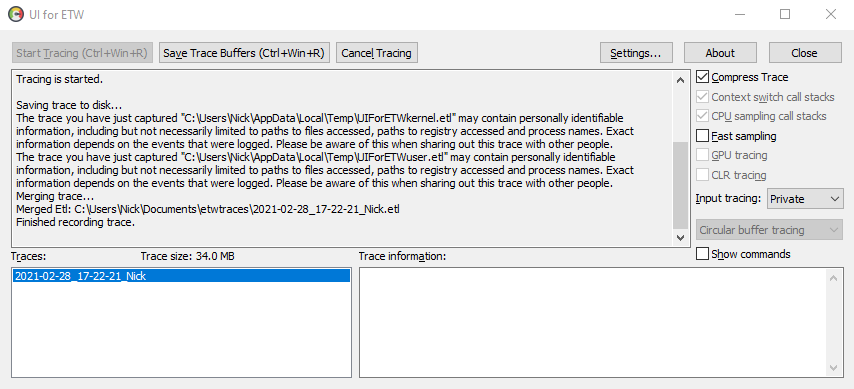
- download UIforETW
- run UIforETW
- select “Start Tracing”
- run the application
- select “Save Trace Buffers”
After those steps there will be a new entry in the “Traces” window. Double clicking on this will open up WPA with the trace information.
Looking at the Trace Data
The trace data will have most everything that was happening on your machine.
I just wanted to focus on win-git-status, so I went to the “CPU Usage
(sampled) inclusive (stack)” view and drilled down into the
win-git-status.exe process.
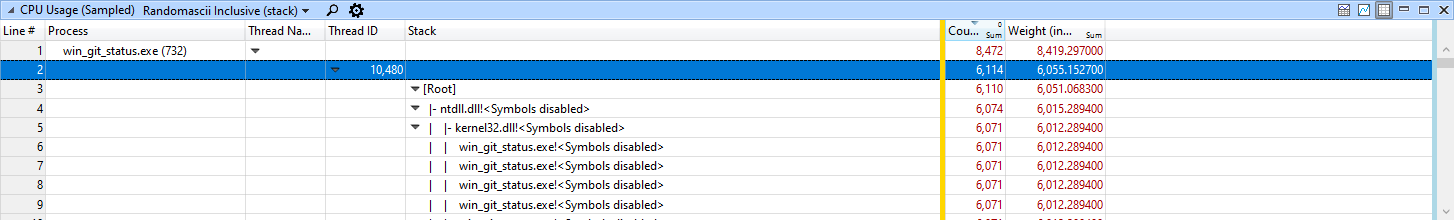
One can see that it says “Symbols Disabled”. This isn’t very useful for determining where any bottlenecks are at.
Loading Symbols
In order to get more information about where in the process any bottlenecks
are at one needs to provide WPA with the debug symbols. On Windows when one
builds a rust exe with debug symbols there is a pdb file with the same name
created next to the exe. This file contains the symbols needed by WPA. In
order to tell WPA where to find this file one should choose the menu option
“Trace -> Configure Symbol Paths”.
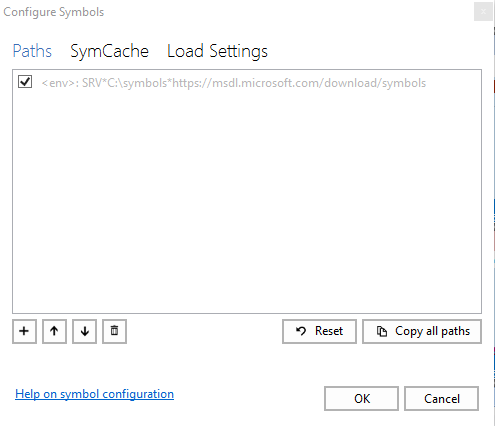
By default there will be a path to download symbols. I would recommend you
uncheck that unless you think you want the symbols for other processes.
Add the directory for the location of the pdb that was generated for the
exe. Then choose the menu option “Trace -> Load Symbols”.
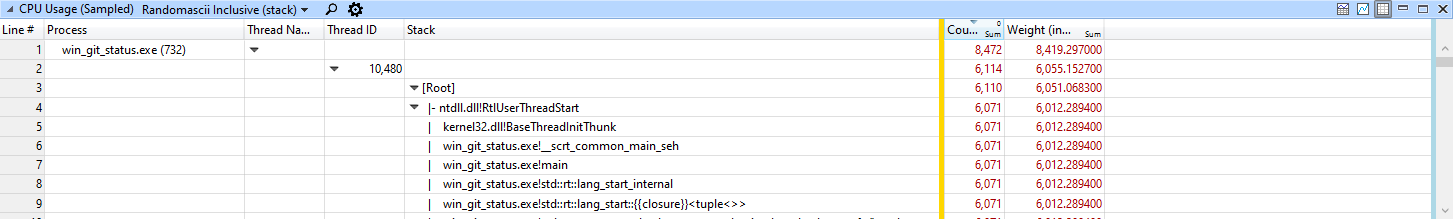
Once the symbols are loaded one should be able to see what functions are causing the performance concerns.
Why win-git-status is Slow
In case you were wondering it looks like win-git-status is opening files
when walking the work tree to get the mtime and file size,
win_git_status.exe!std::sys::windows::fs::File::open. Off to investigate…