Spans in Rust
This post is going to focus on creating spans in rust.
I probably should have mentioned it in the previous post, but Wikipedia has a good high level description of tracing if you’re unsure of the purpose and usage.
I want to start by looking more thoroughly at the tracing-example: step1 title
bar that was clicked on in
Using Jaeger to Capture Traces:
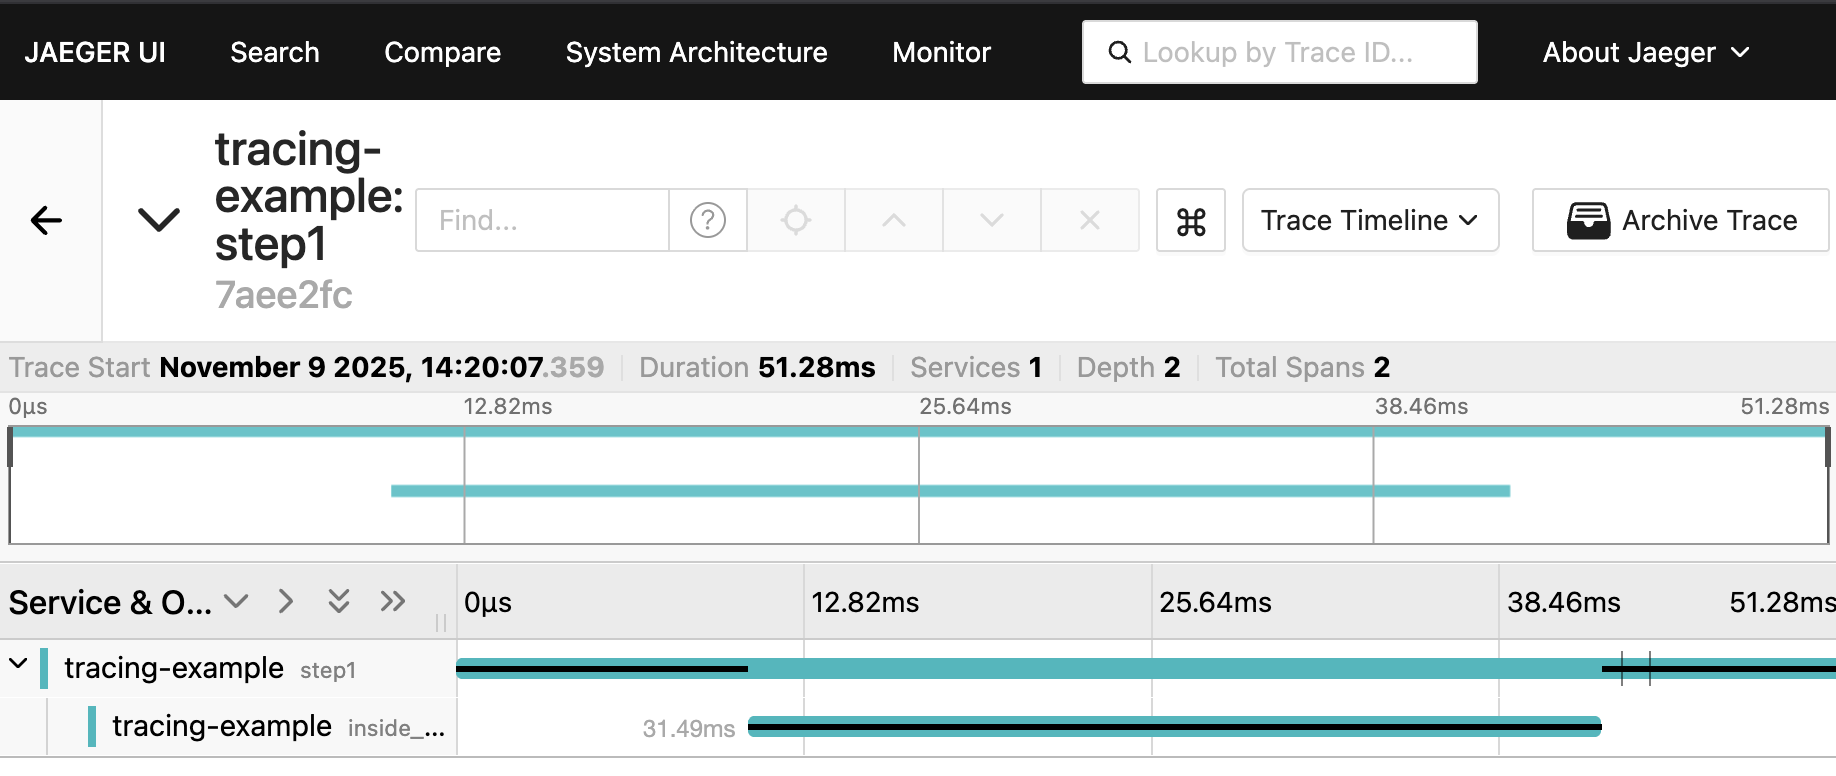
This page represents a full trace. At the bottom of the image one can see it
says tracing-example step1. On the next line and indented we see
tracing-example inside_.... If this weren’t cut off it would have said
tracing-example inside_step1. Each one of these lines is a Span.
One thing to notice in the Jaeger UI is it uses a black line to emphasize what
it thinks is the currently executing function. The trace shows that we entered the function step1() and executed in the
function for a bit less than 12ms, 10ms of which was the sleep call. Then from
within step1() we entered inside_step1(). We spent about 31.5ms in
inside_step1(), 30ms of which was the sleep. We returned to executing in
step1() for almost 10ms again. To be honest I’m not sure why there was 10ms at
the end, and perhaps we’ll find out as we dig in to this post.
The instrument Macro
The previous spans were created via the the
instrument
attribute macro from the tracing crate. The macro was placed on each
function.
#[instrument]
fn step1() {
    sleep(Duration::from_millis(10));
    println!("Step 1");
    inside_step1();
}

#[instrument]
fn inside_step1() {
    sleep(Duration::from_millis(30));
    println!("Inside Step 1");
}
The instrument macro is a nice convenience to create a span per function. The
macro’s full capabilities are more than we want to cover here, I suggest you
read its
documentation if
you get a chance. In particular, the macro can help avoid some rough edges for
async functions. We’re going to ignore async functions for now.
The macro is equivalent to placing the following lines at the start of the function.
    let span = span!(Level::INFO, "step1");
    let _guard = span.enter();
The first line creates a
Span from the
tracing crate. The second line
enters
the span. When the _guard is dropped the span will be exited.
Let’s remove the macro and create the spans ourselves. I chose a slightly
different name than the function name to show it can any str you want.
use tracing::{Level, span};
fn step1() {
    let span = span!(Level::INFO, "manual span for step1");
    let _guard = span.enter();
    sleep(Duration::from_millis(10));
    println!("Step 1");
    inside_step1();
}

fn inside_step1() {
    let span = span!(Level::INFO, "manual span for inside_step1");
    let _guard = span.enter();
    sleep(Duration::from_millis(30));
    println!("Inside Step 1");
}
If we run the example with this change we will see output similar to:
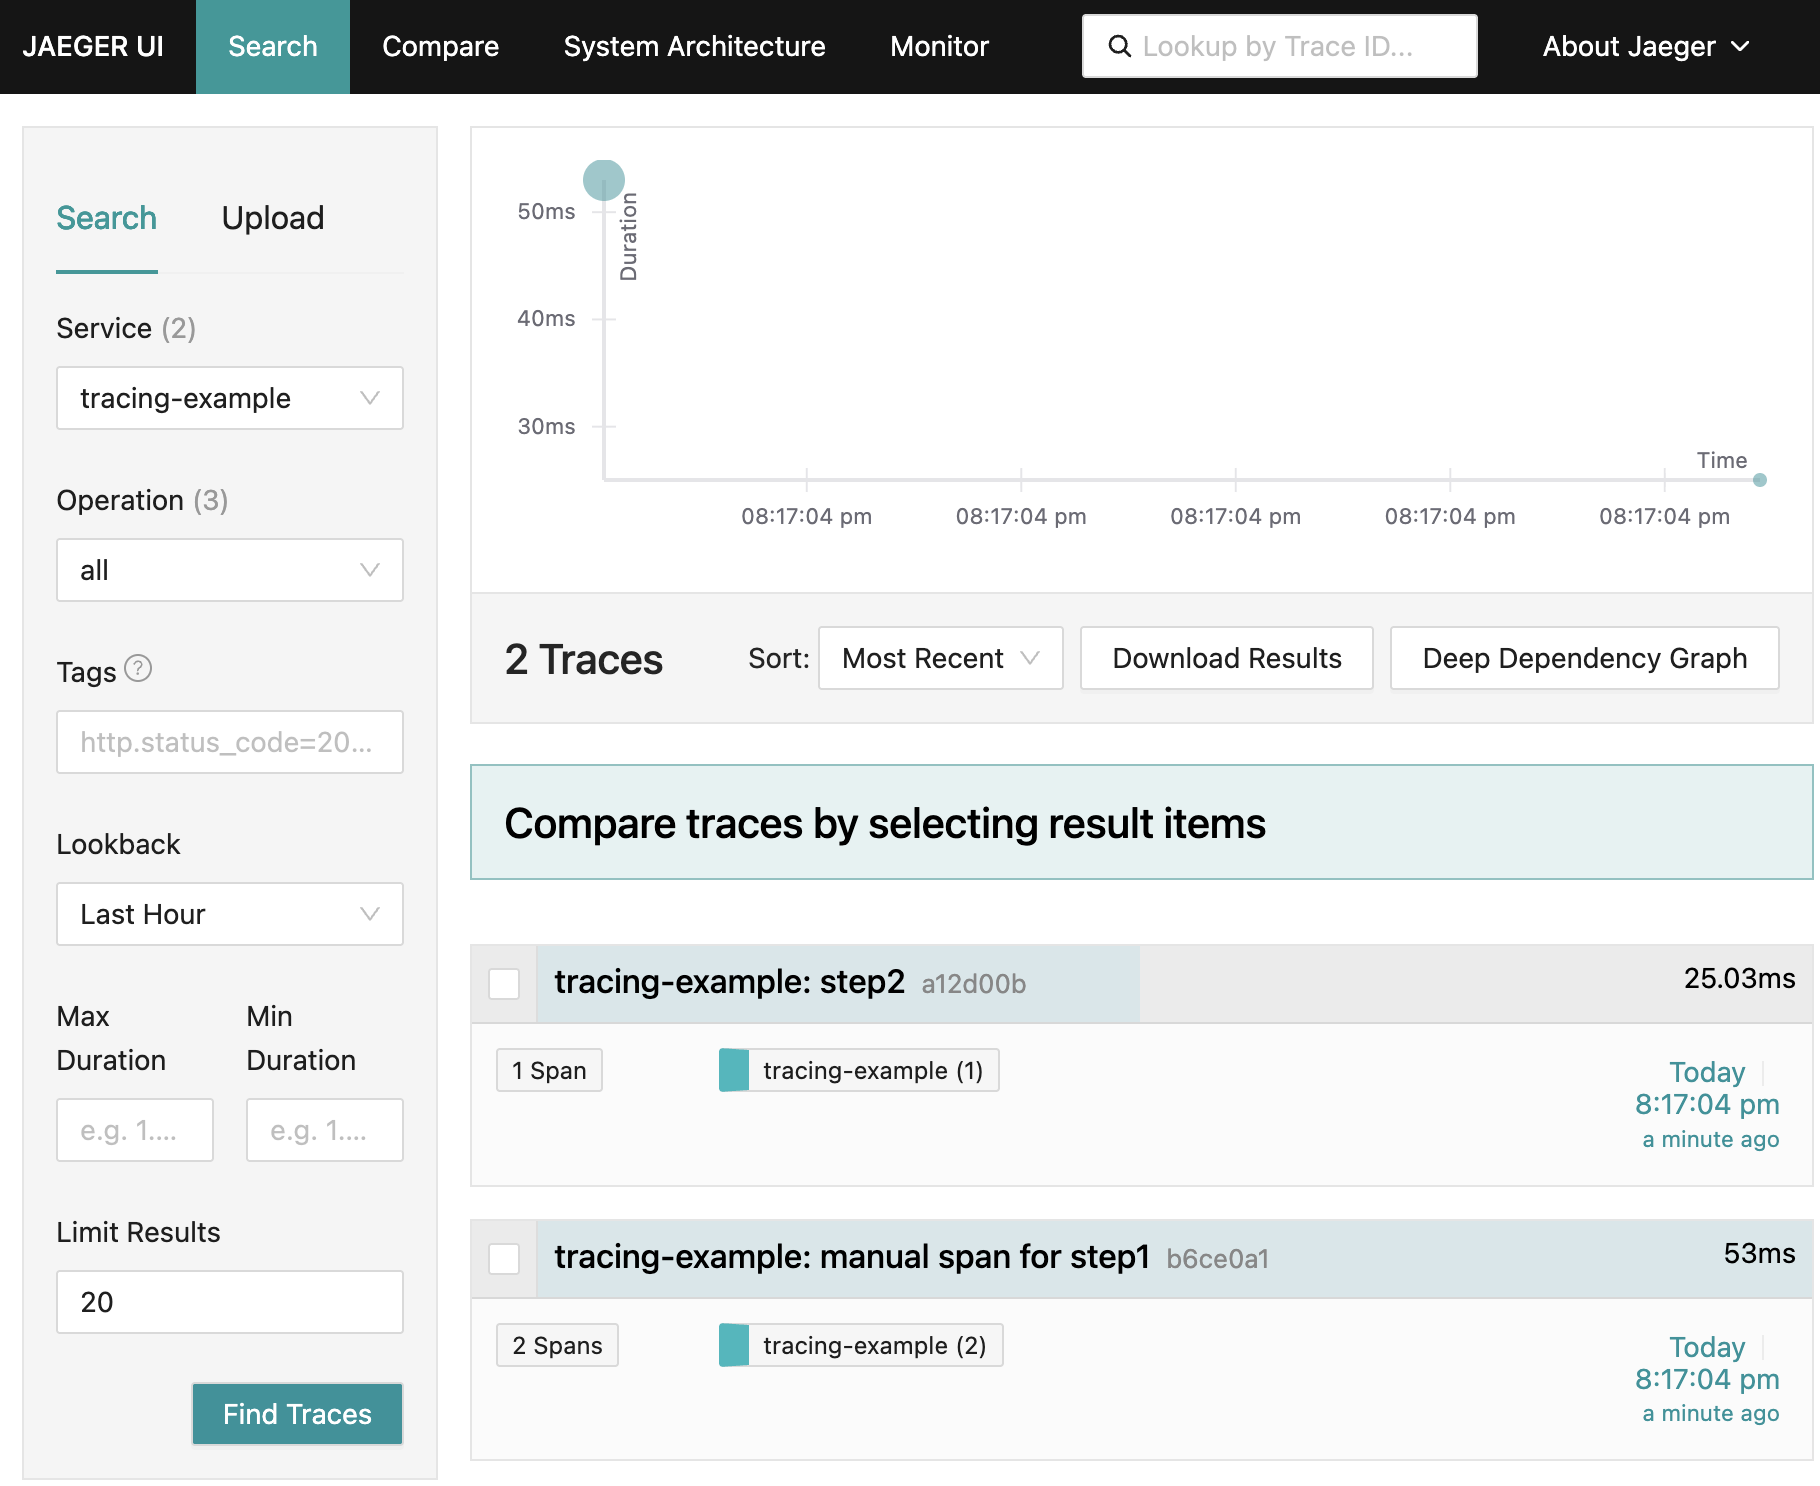
We can see there is a trace title bar for
tracing-example: manual span for step1, which matches the name we provided to
the span!() macro.
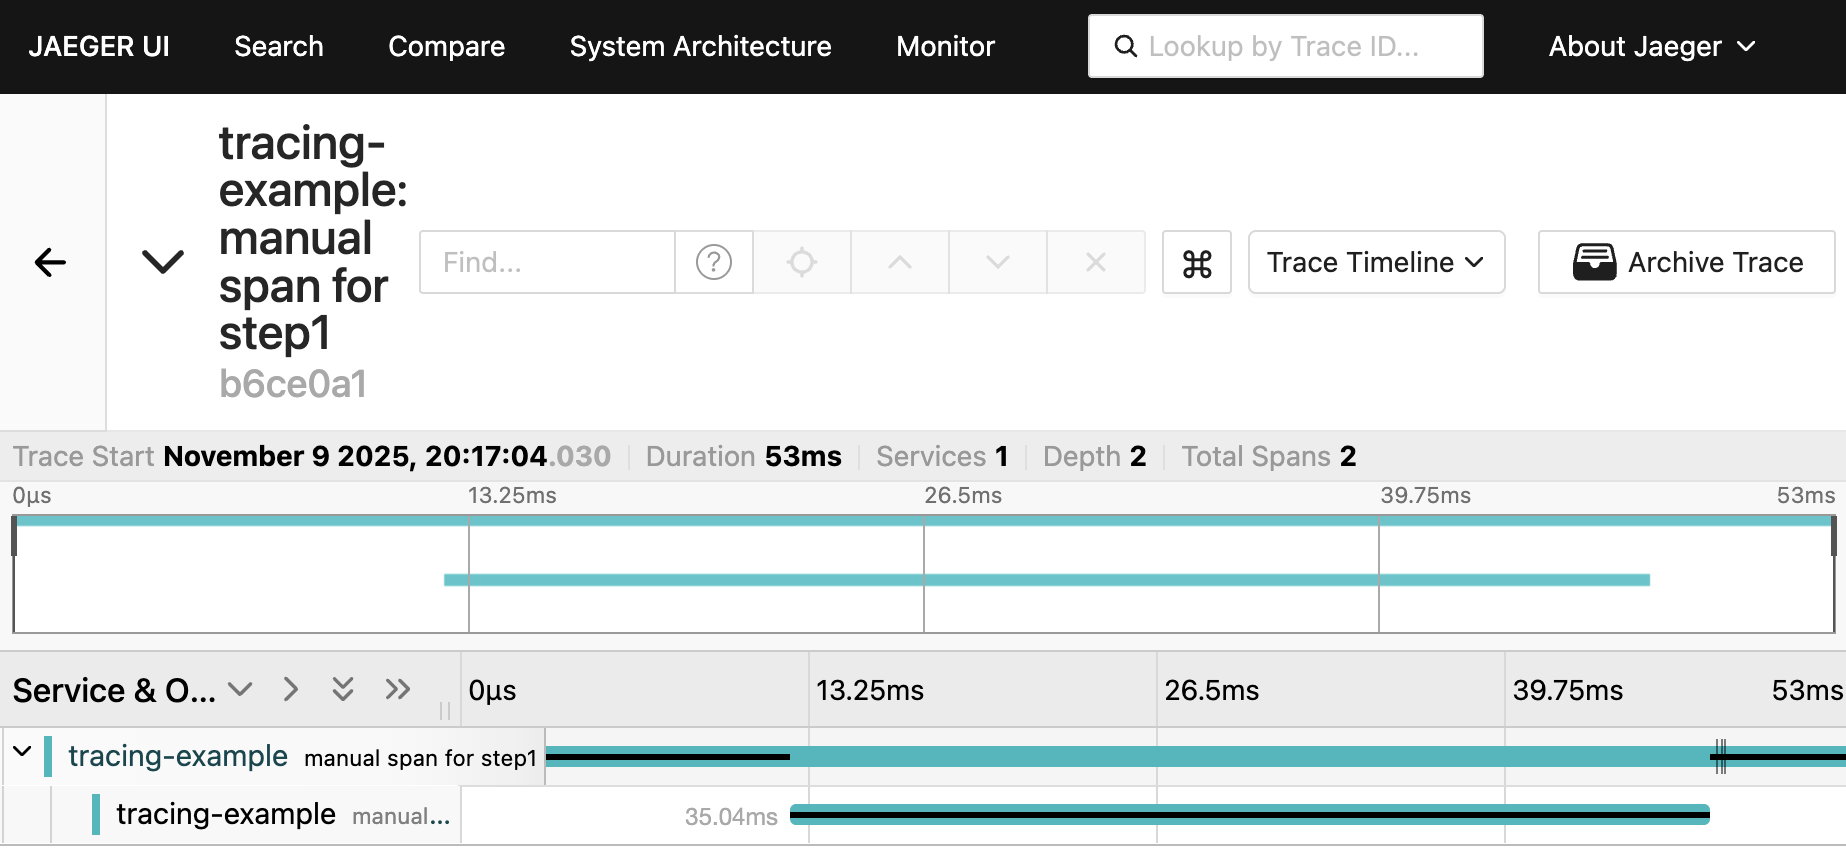
If we click on the title bar for tracing-example: manual span for step1 we’ll
see a page similar to the following:
Multiple Spans In a Function
By creating spans manually we can create multiple spans in a functions. For
example the println!() macro doesn’t have a span on it. We could try to create
a function that wraps println!() and use instrument on that function, but that
would get a bit tedious.
Using block scopes {}, we can create spans and rely on them being dropped at
the end of their respective scope.
fn step1() {
    let span = span!(Level::INFO, "step1");
    let _guard = span.enter();
    {
        let span = span!(Level::INFO, "sleeping");
        let _guard = span.enter();
        sleep(Duration::from_millis(10));
    }
    {
        let span = span!(Level::INFO, "printing");
        let _guard = span.enter();
        println!("Step 1");
    }
    inside_step1();
}
If we run this we should be able to find a trace similar to:
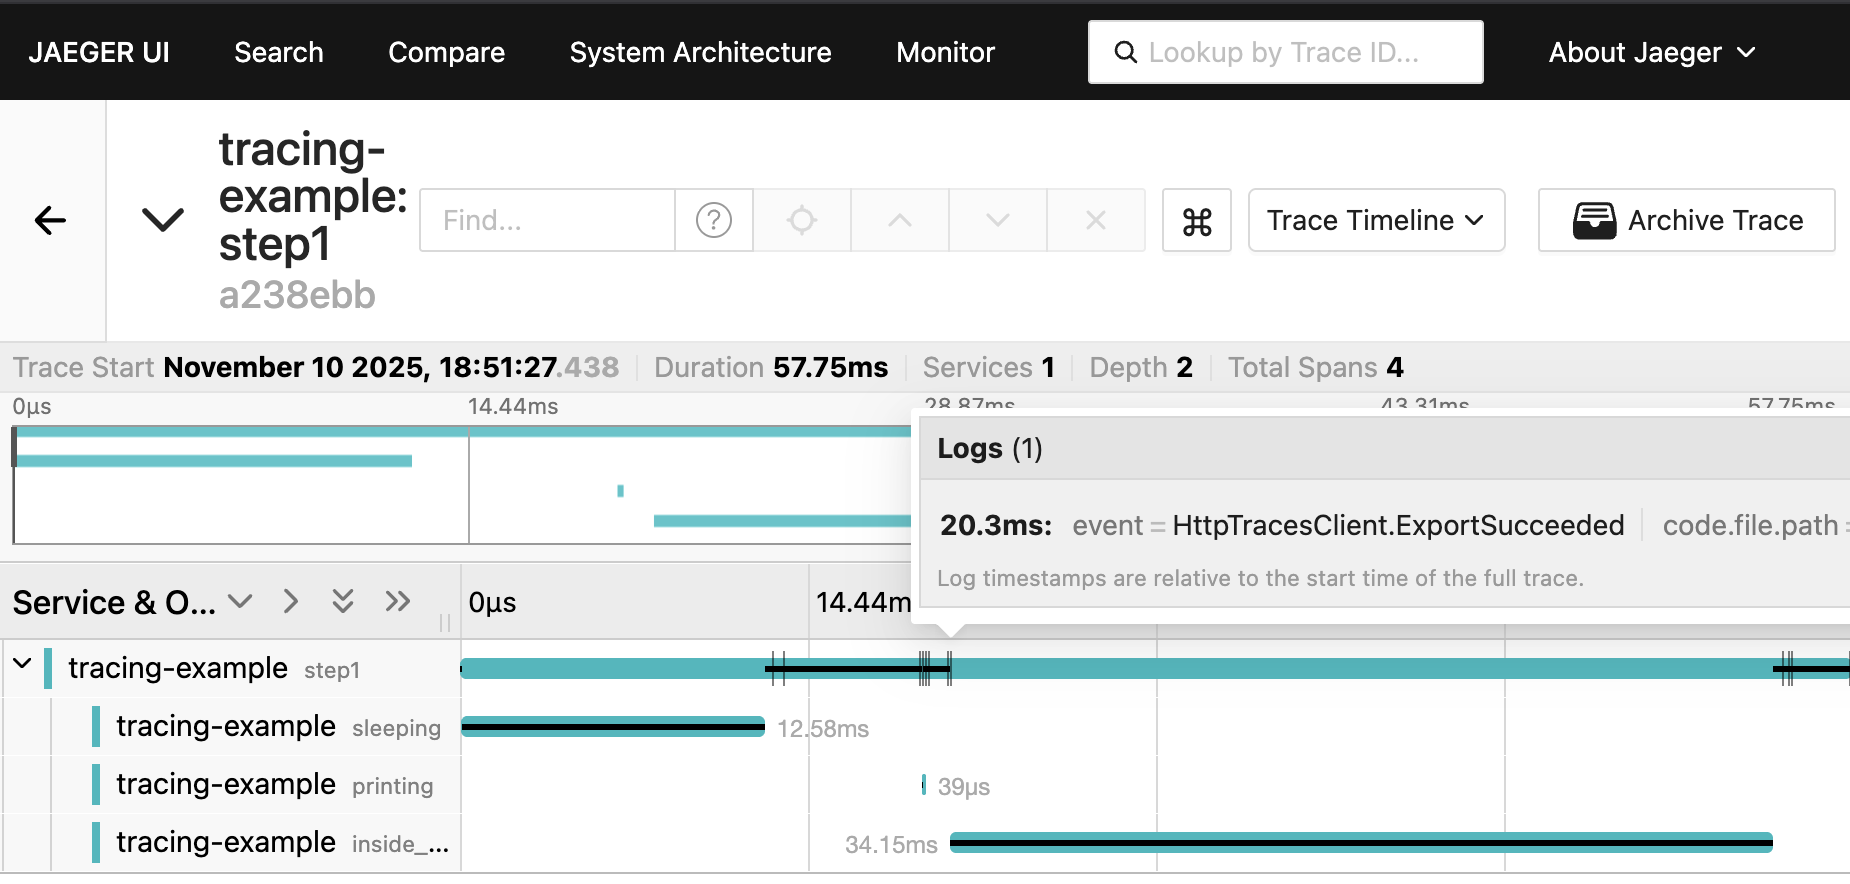
I noticed that adding spans this way increased the time before calling
inside_step1() to ~20ms. I hovered over the tick on the black line in the
Jaeger UI and it happened to show an event HttpTracesClient.ExportSucceeded.
This helps to explain the ~10ms at the end of step1() I couldn’t account for
above. This example uses a
SimpleSpanProcessor
and per the docs.
Spans are exported synchronously in the same thread
This means it’s taking 4-10ms to export spans when they complete.
Instead of using blocks we can use the
in_scope()
function.
fn step1() {
    let span = span!(Level::INFO, "step1");
    let _guard = span.enter();
    span!(Level::INFO, "sleeping").in_scope(|| sleep(Duration::from_millis(10)));
    span!(Level::INFO, "printing").in_scope(|| println!("Step 1"));
    inside_step1();
}
Peeling Back Rust Tracing
The previous traces were created using the tracing crate. I started these posts talking about Opentelemetry tracing. The reason being that Opentelemetry is starting to be the common interface for tracing, and more. The tracing crate with tracing_opentelemetry crate provides a nice abstraction over generating spans and traces. We can drop the tracing crate and instead use the Opentelemetry crates directly.
#!/usr/bin/env -S cargo +nightly -Zscript
---cargo
[dependencies]
opentelemetry = "0.31"
opentelemetry_sdk = "0.31"
opentelemetry-otlp = "0.31"
---

use opentelemetry::{
    Context,
    trace::{TraceContextExt, Tracer},
};
use opentelemetry_otlp::{Protocol, WithExportConfig};
use opentelemetry_sdk::Resource;
use std::{thread::sleep, time::Duration};

fn main() -> Result<(), Box<dyn std::error::Error>> {
    let exporter = opentelemetry_otlp::SpanExporter::builder()
        .with_http()
        .with_protocol(Protocol::HttpJson)
        .build()?;
    let resource = Resource::builder()
        .with_service_name("tracing-example")
        .build();
    let provider = opentelemetry_sdk::trace::SdkTracerProvider::builder()
        .with_resource(resource)
        .with_simple_exporter(exporter)
        .build();
    opentelemetry::global::set_tracer_provider(provider);

    step1();
    step2();
    Ok(())
}

fn step1() {
    let tracer = opentelemetry::global::tracer("tracer-name");
    let span = tracer.start("step1");
    let context = Context::current_with_span(span);
    let _guard = context.attach();
    sleep(Duration::from_millis(10));
    println!("Step 1");
    inside_step1();
}

fn inside_step1() {
    opentelemetry::global::tracer("tracer-name").in_span("inside_step1", |_| {
        sleep(Duration::from_millis(30));
        println!("Inside Step 1");
    });
}

fn step2() {
    opentelemetry::global::tracer("tracer-name").in_span("step2", |_| {
        sleep(Duration::from_millis(20));
        println!("Step 2")
    });
}
step1() has the fully expanded logic, while the other functions leverage the
in_span()
convenience function.
The expanded logic more closely follows the Opentelemetry
api specification. The
Opentelemetry crates need to conform to the api specification. The specification
is written to be programming language agnostic and thus can’t leverage language
specific features.
Using only the Opentelemetry crates can reduce some of the dependencies, but the tracing crate provides a more idiomatic interface for creating and working with spans.